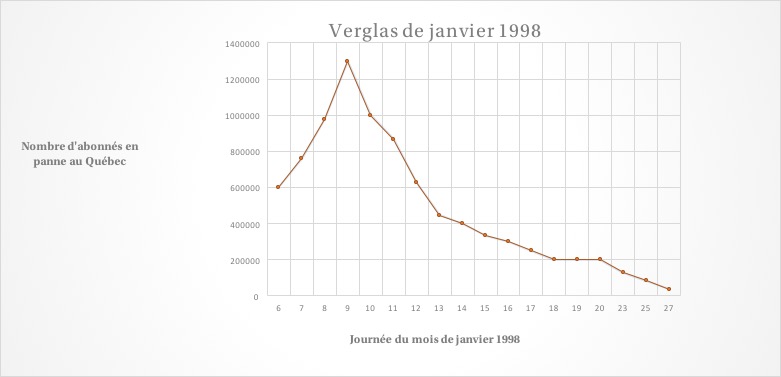
Chart on the evolution of the number of breakdowns in January 1998

Reference: Musée du Haut-Richelieu
The graph shows the evolution of the number of houses without electricity throughout the month of January 1998. This increases very rapidly between January 6 and 9, reaching a maximum between 1,200,000 and 1,400,000 subscribers at the end of the freezing rain. Then, this number gradually decreased to around 50,000 people on January 27. The last house was reconnected on February 8th.

